Plotting Macro Phase-Space Constraints
[1]:
"""
    TITLE   : Plotting Macro Phase-Space Constraints
    PROJECT : macro_lightning
"""

__author__ = "Nathaniel Starkman"
__version__ = "Jun 24, 2020"
About
This notebook gives some examples of the functions in macro_lightning.plot. Of particular note is the function constraint_plot which allows very easy creation of a standardized mass - cross-section constraint plot.
Imports
[2]:
# THIRD PARTY
import matplotlib.pyplot as plt
import numpy as np

# PROJECT-SPECIFIC
import macro_lightning
from macro_lightning import plot
Parameters
[3]:
m_arr = np.logspace(1, 25)
mmin = m_arr.min()
mmax = m_arr.max()

sigmin: float = 1e-15
sigmax: float = 1e25
Individual Plots
Most sources of constraints on macros are offered as individual functions. To name a few, there are:
- plot_white_dwarf_constraints
- plot_cmb_constraints
- plot_superbursts_constraints
- plot_humandeath_constraints
All these functions, and documentation are available in the code, on GitHub, and readthedocs.
We show a few of these constraint plotters below.
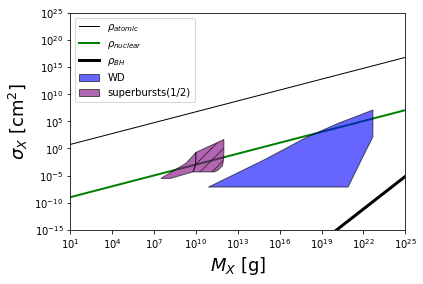
[4]:
fig, ax = plt.subplots(figsize=(6, 4))
ax.set_xlabel(r"$M_{X}$ [g]", fontsize=18)
ax.set_xlim(mmin, mmax)
ax.set_ylim(sigmin, sigmax)  # min/max of nuclear_density(M1)
ax.set_ylabel(r"$\sigma_{X}$ [cm$^{2}$]", fontsize=18)

# first we plot a few reference densities.
plot.plot_reference_densities(m_arr)

# plotting some constraints
plot.plot_white_dwarf_constraints(label=True)
plot.plot_superbursts_constraints(label=True)

plt.legend()
plt.show();
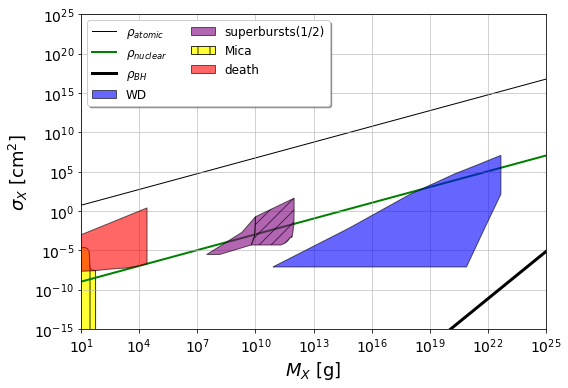
Constraint Plots
For convenience we consolidate all the current constraint plots into a single context manager. This allows for a plot to be defined and additional constraints easily added.
[5]:
with plot.constraints_plot(
    m_arr=m_arr,
    sigmin=sigmin,
    sigmax=sigmax,
    constr_labels=True,
    WD_constr=True,
    superbursts_constr=True,
):
    plot.plot_mica_constraints(label=True)
    plot.plot_humandeath_constraints(label=True)

    # any plotting code can be added here.

plt.show();
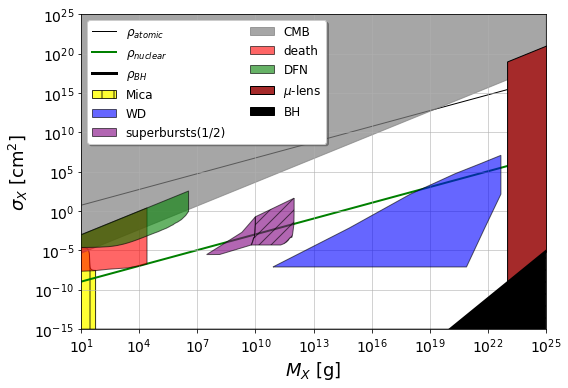
And demonstrating all available constraints
[6]:
with plot.constraints_plot(
    m_arr=m_arr,
    sigmin=sigmin,
    sigmax=sigmax,
    all_constrs=True,
    constr_labels=True,
    savefig="figures/full_constraints_plot.pdf",
):
    pass

plt.show();
END